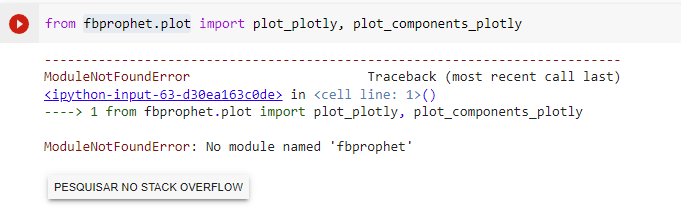
from prophet.plot import plot_plotly, plot_components_plotly
Fabio
Author
Posts
Viewing 2 posts - 1 through 2 (of 2 total)
You must be logged in to reply to this topic.
O IA Expert Academy utiliza cookies para lhe oferecer uma melhor experiência em nosso site. Conheça nossa política de cookies. Ao continuar a navegar no site você concorda com sua utilização. Leia este artigo caso queira desabilitar os cookies no seu navegador.
This website uses cookies to improve your experience while you navigate through the website. Out of these cookies, the cookies that are categorized as necessary are stored on your browser as they are essential for the working of basic functionalities of the website. We also use third-party cookies that help us analyze and understand how you use this website. These cookies will be stored in your browser only with your consent. You also have the option to opt-out of these cookies. But opting out of some of these cookies may have an effect on your browsing experience.
Necessary cookies are absolutely essential for the website to function properly. This category only includes cookies that ensures basic functionalities and security features of the website. These cookies do not store any personal information.
Any cookies that may not be particularly necessary for the website to function and is used specifically to collect user personal data via analytics, ads, other embedded contents are termed as non-necessary cookies. It is mandatory to procure user consent prior to running these cookies on your website.
.