- This topic has 1 reply, 2 voices, and was last updated 3 years, 2 months ago by
.
Viewing 2 posts - 1 through 2 (of 2 total)
Viewing 2 posts - 1 through 2 (of 2 total)
- You must be logged in to reply to this topic.
Home › Forums › Fórum Interface Gráfica para Apps Python com GTK e Glade › Load csv e Plot com Plotly
Bom dia,
gostaria de saber se com essa ferramenta há como criar um programa que leia um arquivo csv e plote os resultados usando o plotly? Se sim, há algum material que recomende dar uma estudada?
Olá, sim é possivel, vou te deixar algumas referencias que pode ajudar:
https://gtk3-matplotlib-cookbook.readthedocs.io/en/latest/hello-plot.html#embedding-matplotlib
https://matplotlib.org/stable/gallery/user_interfaces/embedding_in_gtk3_sgskip.html
https://www.scaler.com/topics/matplotlib/integrating-a-plot-to-a-gtk-user-interface/
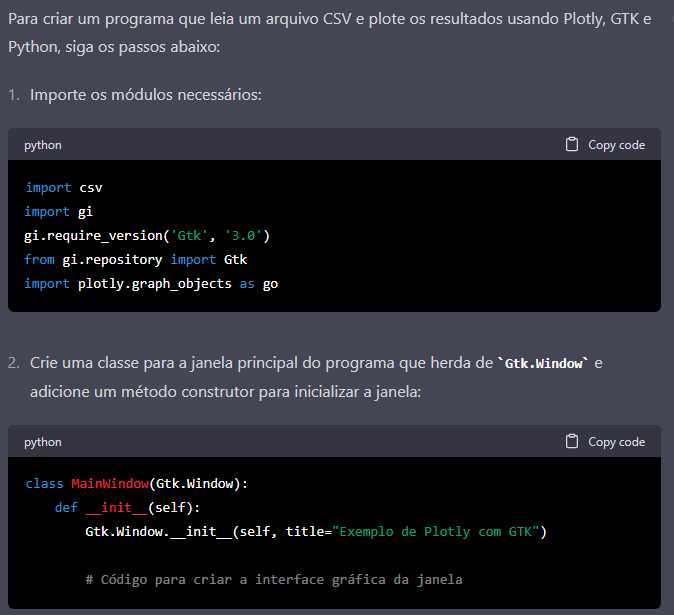
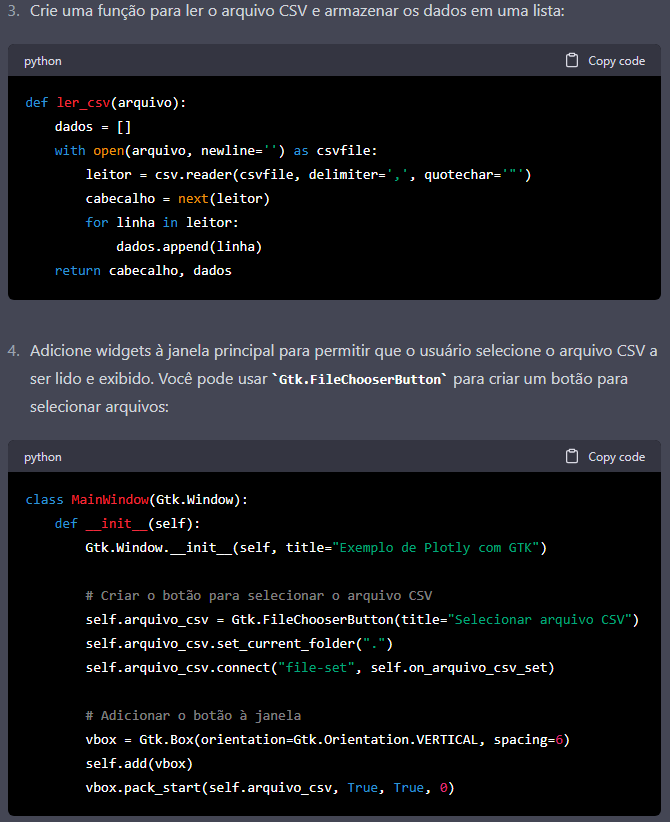
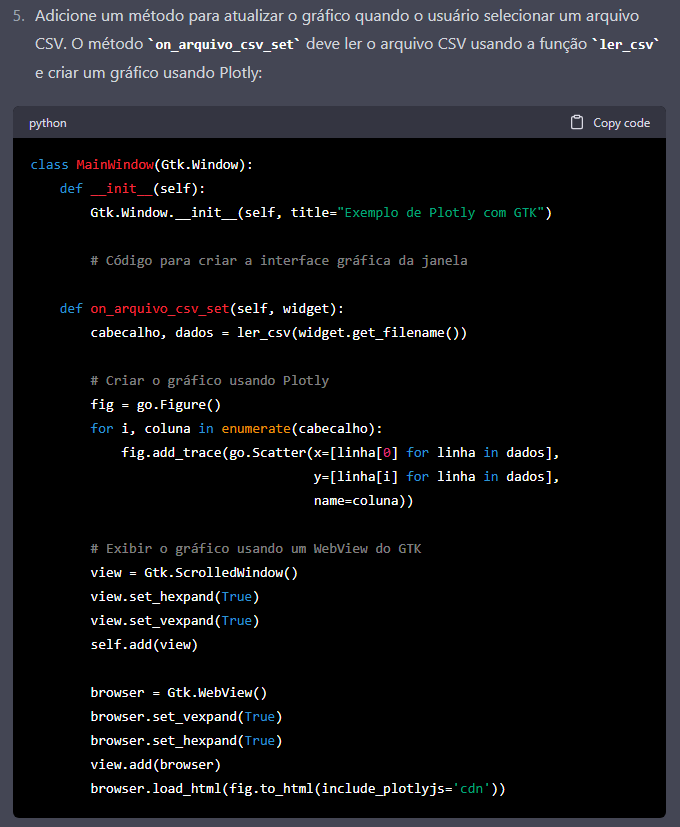
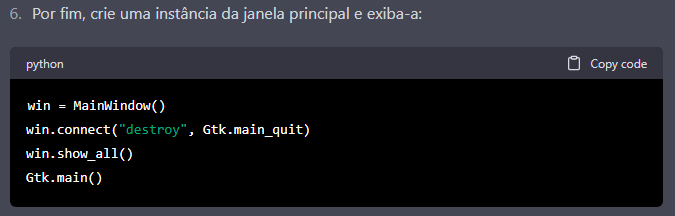
E essa é a resposta do chat GPT: